Benyenda Citrus, Gayndah
Energy Savings: 35% | Cost Savings: $35,515 | Capital Cost: 116,894 | CO2 Savings: 60.3 tCO2-e | Project Status: Proposed
Industry:
Horticulture
Location:
Wide Bay Burnett
Pump Type:
Not applicable
Irrigation Type:
Not applicable
Technology:
Power Factor Correction, Solar Power and Renewables

The Farm
Benyenda Citrus have been in operation since 1921 producing Grapefruits, Mandarins, Lemons, Limes, and Oranges. There is always some harvesting taking place throughout the year. The quietest months are September - November, with the busiest months being April - August. The annual energy consumption can vary noticeably dependent upon growing conditions and the amount of produce harvested.
The energy audit focused on the site Packing shed which includes a packing line and refrigeration. The Packhouse is used to collect, store, and package the citrus fruit ready for shipping.
The primary energy used on site is electricity sourced from the grid with some LPG used for a fruit drying line.
The site has a main electricity meter that supplies power to the whole site. There is a separate electricity connection for irrigation.
The energy audit
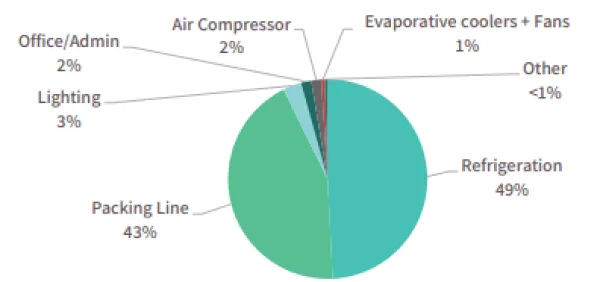
The packhouse used 231,740 kWh during the previous year at a cost of $77,290. The Energy Use balance shows that electricity consumption was mainly in refrigeration (49%) and the packing line (43%) as shown in Figure 1.

Figure 1 Energy Use Balance
The packing line is used on an as needs basis during packing – that is, switched on and off as needed. The refrigeration system consists of 6 cool rooms of different size and age, used intermittently throughout some of the harvest periods. The shed lighting has already been upgraded to energy efficient LED lighting.
The cool room panels, door seals and air curtains were in reasonable condition.
The auditor analysed site interval data to be able to assess daily and seasonal energy consumption patterns. Figure 2 shows the average daily load profile for the site by month, showing how that although there is a large proportion of energy used during the day, there is still a high overnight load during certain months while cold rooms are operating.
It also appears to show that the packing lines are shut down during break times, saving on energy consumption.
The shape of the load profile is consistent with the likely generation profile from a Solar PV system.

Figure 2: Average daily load profile by month
Energy management opportunities
Three energy management opportunities identified in the audit are as follows:
Install a solar system:
The auditor recommended a 99kW Solar PV system for the site which would produce around 151,000 kWh per year, or equivalent to around 65% of the site energy consumption. It is important to note that, as the site has seasonal energy consumption, it is likely that the system will offset around 78,000 kWh of grid power and export around 73,000 kWh with no feed in tariff available.
A system below 100 kWp will be eligible small-scale technology certificates (STCs), these have a financial value and can be offered as an upfront discount, decreasing the capital investment of the project, and improving the payback period.
Power factor correction (PF)
Demand charges are based on the highest monthly electrical 30-minute demand reading. Power Factor averages around 0.8. This means that there is potential to improve PF with the installation of a Power Factor Correction Unit. This improve the Power Factor 1 and reduce the associated demand costs, saving up to $7,486 per annum.
Packing line idle time reduction
Figure 2 shows that the reduction in power demand during the breaks when the packing line is turned off can be up to 65kW. The audit noted that if the farm can identify additional periods when the packing line equipment can be switched off. For example, the time could be reduced by 30 minutes per day for the 150 days of the year it is used, it may reduce costs by around $1,000 per year.
Summary of recommendations:
The recommendations from the audit have been summarised in the table below:
Recommendation | Annual Energy Savings (kWh) | Annual Costs Savings ($) | Emission Savings (tCO2-e) | Capital Cost ($) | Payback Period (Years) |
Install a Solar Power System | 77,794 | $21,691 | 56.8 | $100,894 | 4.9 |
Power factor correction | 0 | $7,246 | 0 | $16,000 | 2.2 |
Packing line idle time reduction | 4,875 | $938 | 3.6 | 0 | 0 |
TOTAL | 82,669 | $35,515 | 60.3 | $116,894 |
Virtual net metering
The auditor also noted the potential for a Virtual Net Metering (VNM) contract to assist in improving the solar power business case.
If this was available, surplus power from the new Solar PV system could be ‘netted off’ in real time to other nearby electricity meters. For example, the solar generated at the Packhouse could be used at another site such as the irrigation pump when the solar is generating more than the Packhouse is consuming.
The audit estimated that if 25% of the solar export could be made available to the irrigation pump it could save an additional $5,400.
Energy Audits. The farm had a Type 2 energy audit as a participant in the QBEST Ag program.
The program was delivered by the Queensland Farmers’ Federation and funded by the Queensland Government.
