Childers Nursery
Energy Savings: 127% | Cost Savings: $4,405 | Capital Cost: $24,750 | CO2 Savings: 17.3 | Project Status: implemented
Industry:
Nursery and garden
Location:
Wide Bay Burnett
Pump Type:
Booster, Bore
Irrigation Type:
Not applicable
Technology:
Solar Power and Renewables, Tariffs
The site is 50 ha with a production area covering 8 ha consisting of growing areas, a propagation facility used 6 months of the year, and a potting area. The irrigation system operates during the day all year-round producing an average of 7,500 units per ha per year.
Energy consumption varies with the seasons, with the highest peak demand in summer due to irrigation requirements. The highest energy consumption occurs between 11 am and 2 pm. As the nursery plans to expand the range of plants, production and electricity needs are expected to increase.
The annual energy consumption for the site during the 2019-2020 period was 16,925kWh at a cost of $5,482, and energy consumption on the farm consists of:
- Irrigation: two bore pumps and a booster pump with Variable Speed Drive.
- Propagation facility: includes 2 heat mats and a small water pump.
- Potting system: consisting of a new potting machine.
- Other minor uses: a workshop, irrigation controls, and staff facilities.
A recent energy audit showed how improving the current systems can lead to energy and cost savings. The audit recommendations are:
- Tariff Change: Change from transitional tariff 65 that will be phased out during 2021 to optimal Time of Use tariff 20.
- A 15kW Grid Connected Solar PV: to offset all the electricity required from the grid and feed into the grid when possible.
Table 1. Costs and savings from audit recommendations.
| Recommendations | Annual Energy Savings (kWh) | Annual Costs Savings ($) | Emission Savings (tCO2-e) | Capital Cost ($) | Payback Period (Years) |
| Tariff Change | – | 1,347 | – | – | – |
| 15 kW Solar PV | 22,710 | 4,736 | 21.8 | 24,750 | 5.2 |
Total |
22,710 | 6,083 | 21.8 | 24,750 | 5.2 |
The replacement of heat mats with more efficient systems was considered, but given the intermittent use of this equipment and the small heated area, the solution was deemed uneconomic with a long payback period and a small return on investment. The auditor suggested replacing the heat mats if they fail over time.
The nursery has proceeded with the installation of a slightly smaller 12-kW solar PV system. The savings have been measured in a Measurement and Verification (M&V) process as outlined in Table 2.
Table 2. Estimated and Actual energy and costs savings from Solar PV.
| Metric | Audit estimation | M&V calculation* | Variation (%) |
| Energy Savings including exports (kWh) | 22,710 | 21,408 | -6 |
| Cost Savings including exports revenue ($) | 4,736 | 4,045 | -15 |
* Extrapolated from 9 months of measured data.
Lower savings have been achieved in line with the smaller system implemented compared to the recommendation. Although the farmer opted for a system 20% smaller, the energy and cost savings achieved were not 20% lower, so the farmer is getting more than expected from the new system.
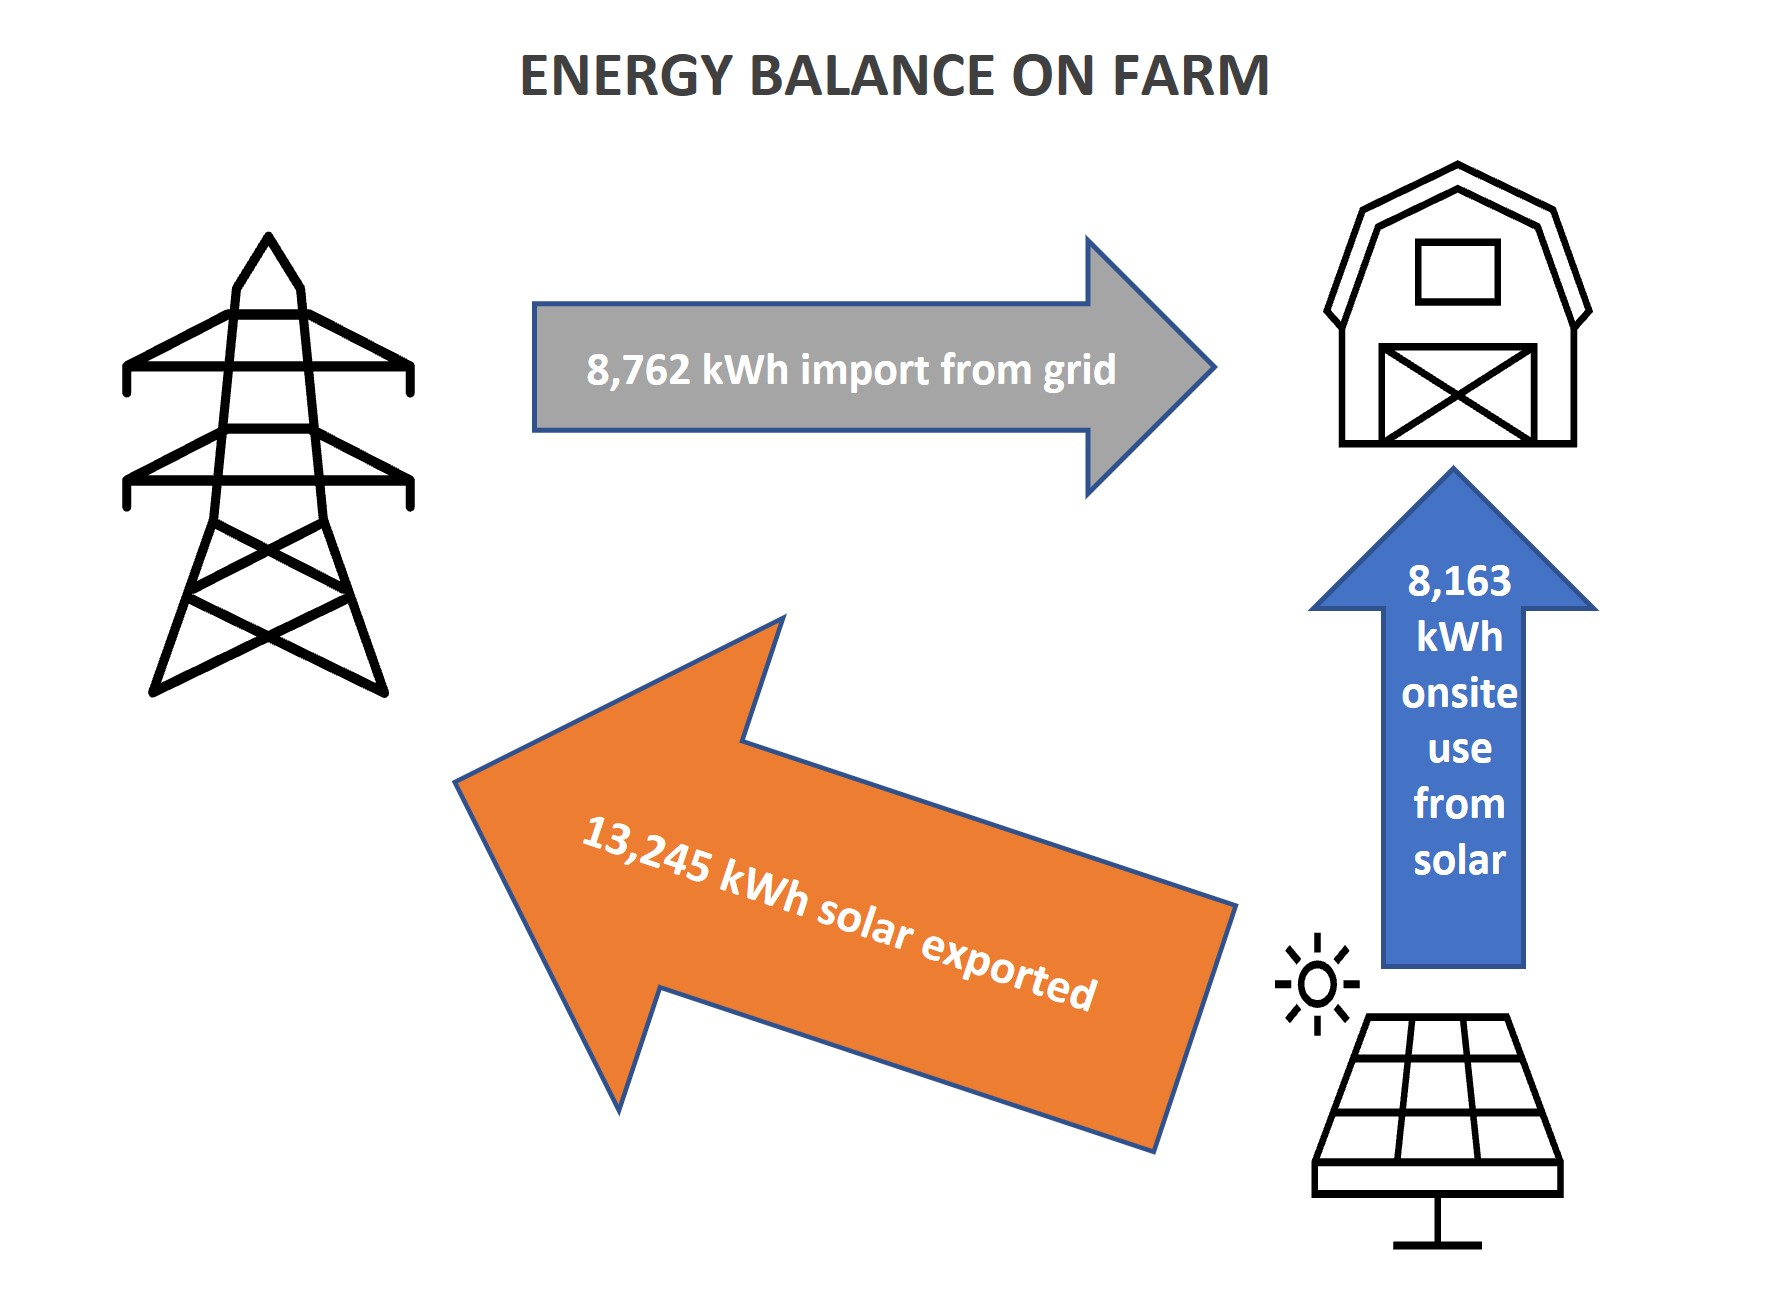
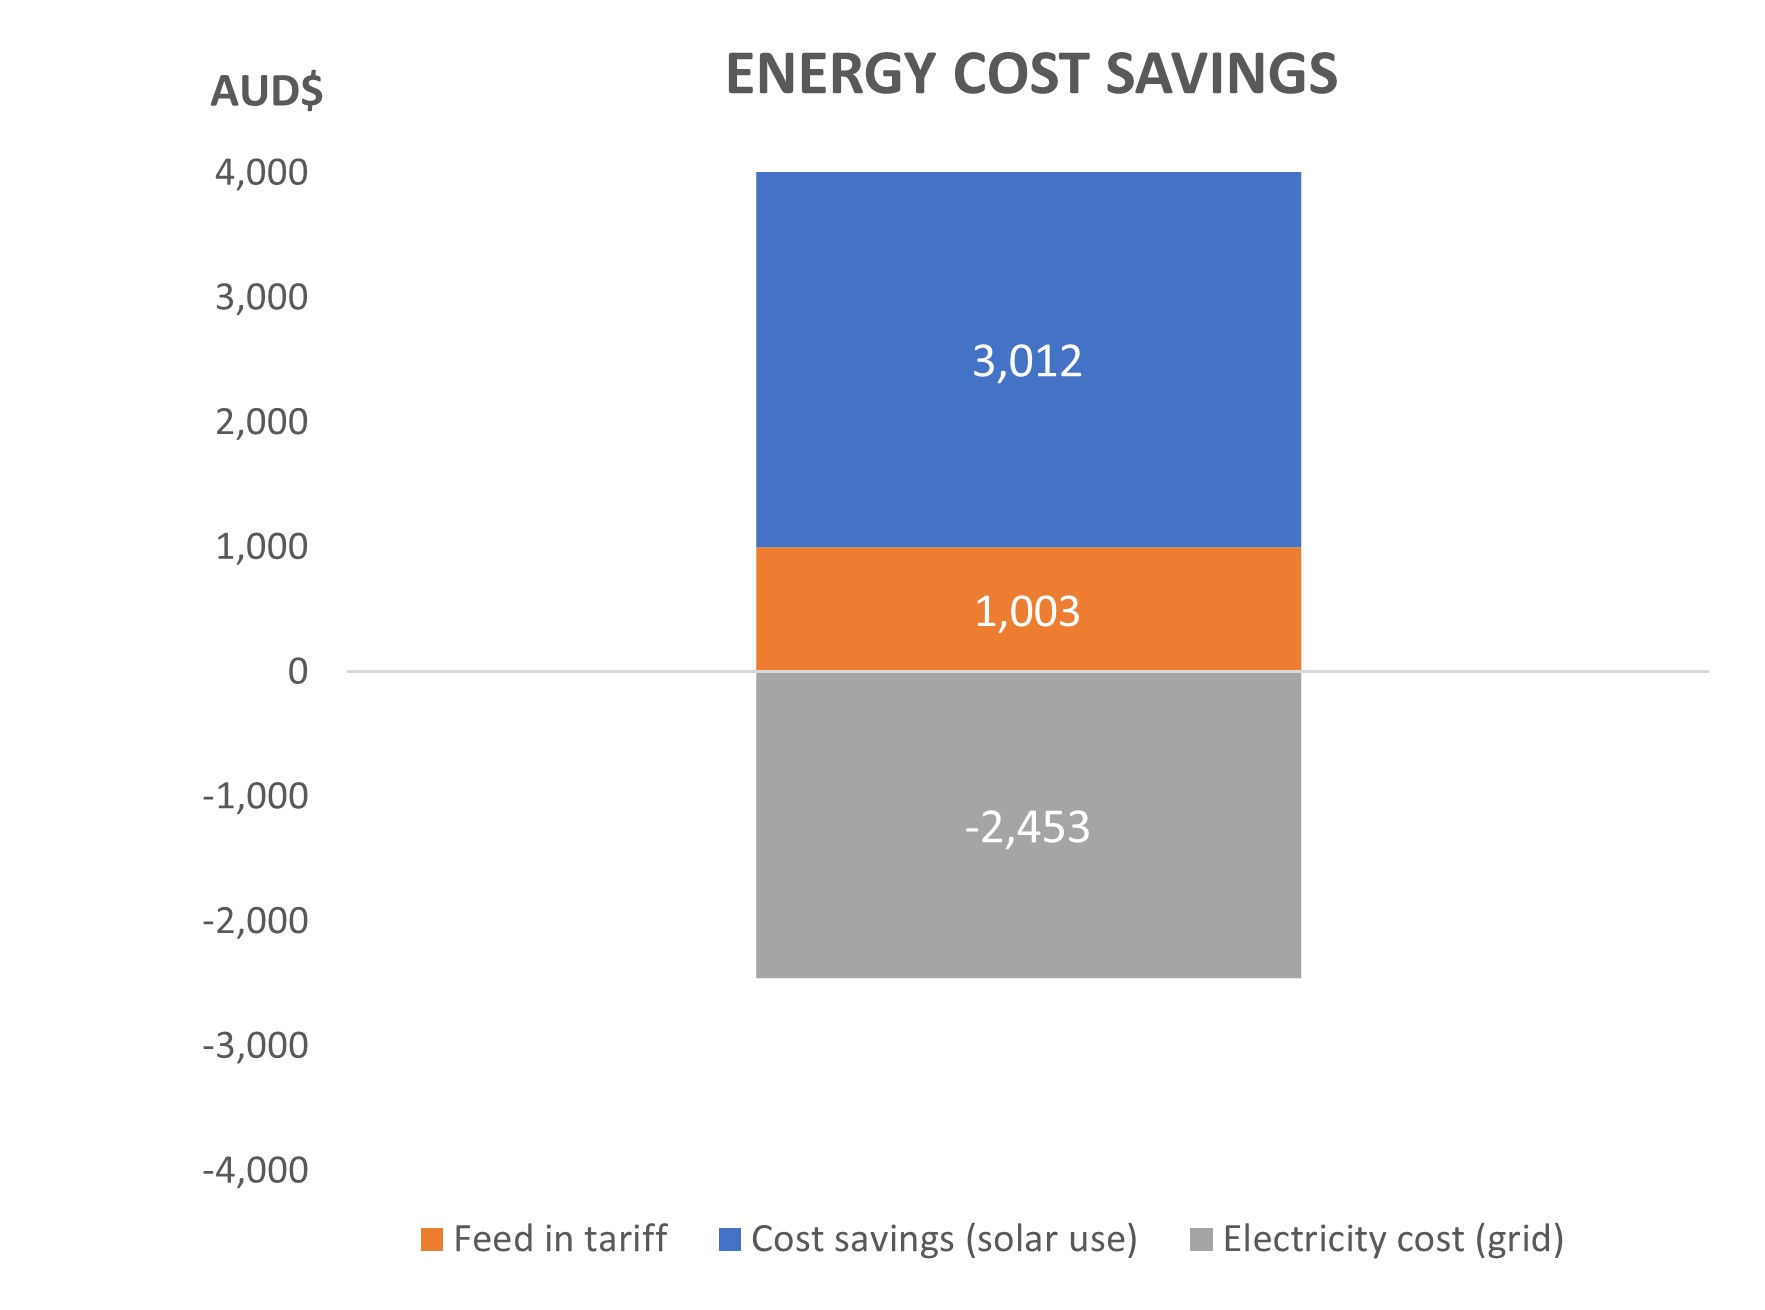
The cost savings achieved have also been influenced by changes in solar energy use. Only 8,163 kWh or 38% of total solar generation are being used onsite valued at $3,012, and around 13,245 kWh are being exported to the grid with a revenue of $1,003. Considering that 8,762 kWh – 52% of the total energy used onsite – are being imported from the grid at a cost of $2,453, there are significant potential savings from shifting consumption into the solar generation period. The total power balance of the farm, including solar exports and the energy cost distribution, are shown in the following figures.


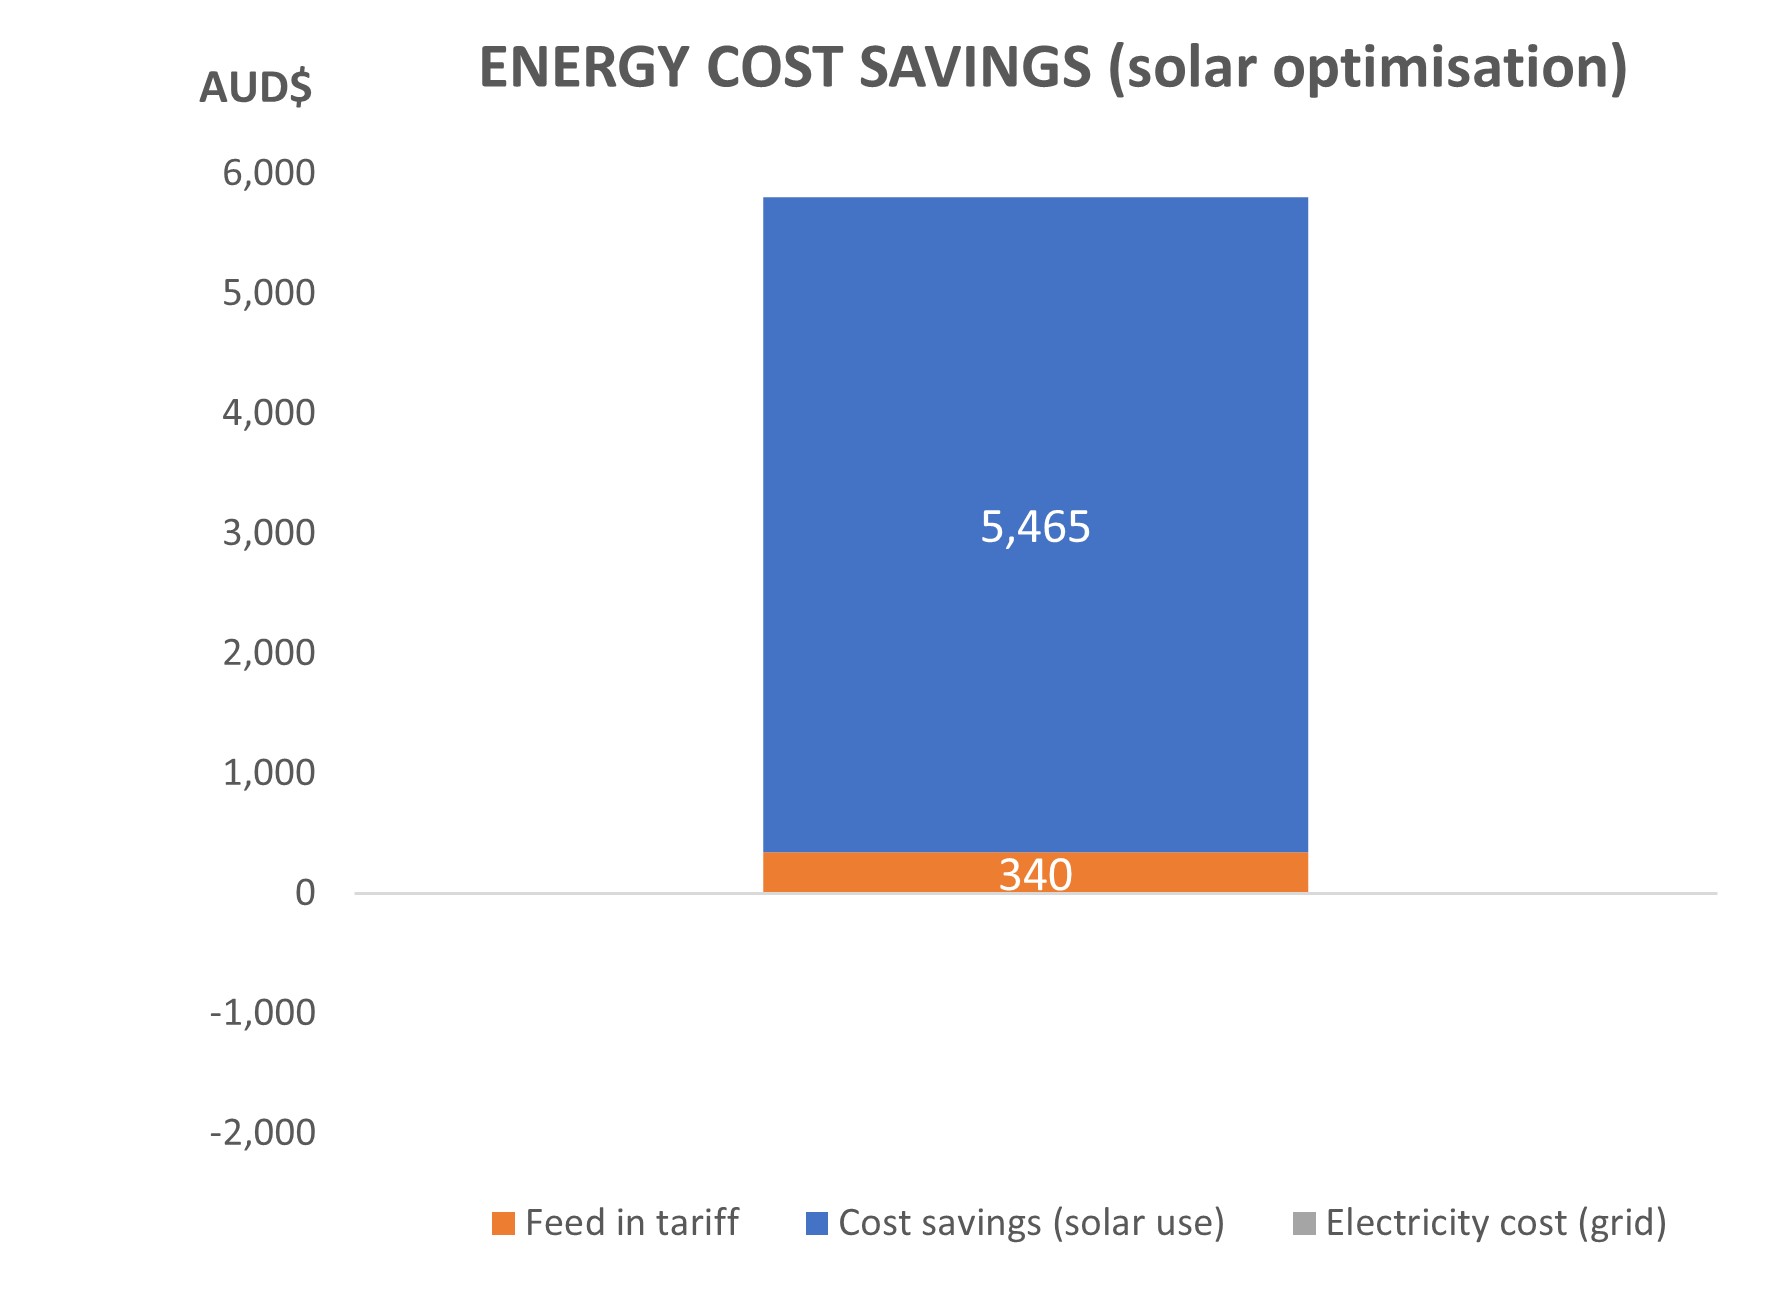
The next step for the farm is to adjust energy usage to offset as much energy consumption as possible from the grid, which would lead to further cost savings. The revenue from feeding into the grid is lower than the cost savings from using the energy onsite: for every dollar of energy exported, around $2 could be saved if the energy were consumed onsite. If the farm were to shift 8,762kWh of energy consumption per year to coincide with solar generation times, they would save an extra $1,450 per year.

The auditor recommended reviewing electricity use and changing use patterns to reduce the small peaks in daily electricity consumption, matching energy consumption with solar generation. See HERE a similar case where better solar utilisation can lead to significant energy and cost savings.
From the implementation of recommendations in the audit, the farm has reduced energy consumption by 127%, thus becoming a net exporter of power. Costs have been reduced by 74%, including feed-in revenue, with Carbon emission savings of 17.3 t/CO2-e per year.
Table 3. Pre and post implementation energy, costs, and energy productivity improvements.
| Metric | Pre- implementation | Post- implementation | Reduction (%) |
| Energy Consumption (kWh) | 16,925 | -4,483 | 127 |
| Cost ($) | 5,482 | 1,437 | 74 |
| Energy Productivity (kWh/ha) | 2,116 | -560 | 127 |
An energy audit is a good investment.
An energy audit is a great first step in moving a business towards a more efficient future by reducing energy use, costs and carbon emissions onsite.
The Energy Savers Plus Extension Program was delivered by the Queensland Farmers Federation with support and funding from the Queensland Department of Energy and Public Works.

