Case Studies

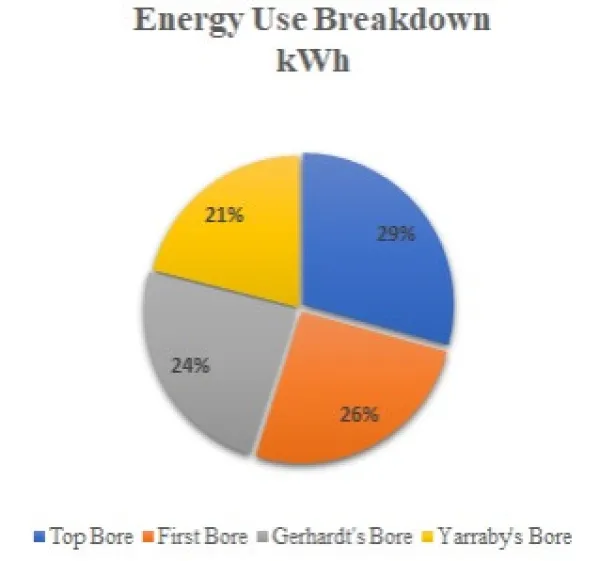
This 700 hectare property on the Darling Downs grows cotton and sorghum, flood irrigated from four bores. At the time of the audit the region was drought declared, and the farm was receiving the drought relief waiver on its electricity account, which removes the service fee and pump capacity charges on the transitional farming tariff.
The audit inspected all four bores and found each operating under different conditions, with different duty points and friction losses. One pump had four separate duty points depending on where the water was being sent, each with different friction losses, and was found to be running at 39.6 per cent efficiency.
The four meters on site have 274,418kWh of energy consumed costing $58,373 per annum resulting in emissions of 252 tCO2-e.
To reduce energy consumption and costs onsite the audit recommended:
Install two new 22kW efficient pumps.
Four 20kw solar systems at the different pump sites.
The potential total energy savings determined from the audit were 105,373kWh, with costs savings of $29,131 and a reduction of 96.9 tCO2–e. The total capital expenditure required for these savings is $119,620 with a payback period of 4.2 years.
Table 1. Recommendations and Savings from the Energy Audit.
| Recommendation | Cost to Implement ($) | Energy savings (kWh) | Cost Savings ($) | Payback Period (Years) | Emission Savings (tCO2-e) |
| Replace pump one 22kW | 15,890 | 40,316 | 8,576 | 3.9 | 36.2 |
| Replace pump two 22kW | 15,890 | 25,275 | 5,376 | 3.0 | 23.2 |
| Four 20kW Solar PV | 87,840 | 39,782 | 15,087 | 5.8 | 36.4 |
| Total | 119,620 | 105,373 | 29,131 | 4.2 | 95.8 |
The audit measured each pump on energy consumed per megalitre of water per metre of head, a benchmark that allows any pump to be compared against any other. Across the four bores on this property the figures ranged from 4.36 to 8.10 kWh/ML/m head. The worst-performing pump was using close to twice the energy of the best to move the same water the same height, and was running at 39.6 per cent efficiency.
It is recommended to replace the top bore pump with a pump matched to the task requirements. Before replacing the pump there are four duty points to consider each with different friction losses, due to the irrigation design. With the replacement, pumping hours would be reduced by 35% and pump energy consumption by 50.2%. The second bore requires the same considerations due to the different friction losses, this replacement should reduce the pumping hours by 8% and the pump energy consumption by 35.9%. The payback period for the pumps is 1.9 and 3 years, respectively, with a reduction of 65,591kWh and costs of $13,952.
Collectively, by installing four 20kW solar systems at the separate NMIS consumption could be reduced by 39,782kWh and costs by $15,087.
Following the audit recommendations, the grower replaced pump one. A measurement and verification assessment was carried out after installation to confirm actual performance. Pump efficiency improved from 39.6 per cent to approximately 77 per cent, and pump performance improved by 48.4 per cent, from 8.10 to 4.18 kWh/ML/m head. The pump now delivers the same volume of water in 1,524 operating hours instead of 2,239, using a third less electricity.
The installed cost was $28,117, above the audit estimate of $15,890, and the verified payback was 3.9 years rather than the 1.9 years originally modelled. Post-implementation savings across the farm were 10 per cent on energy and 12 per cent on cost, as follows.
Table 2. Actual savings from Implemented solution.
| Recommendation | Cost to Implement ($) | Energy savings (kWh) | Cost Savings ($) | Payback Period (Years) | Emission Savings (tCO2-e) |
| Replacement of pump one 22kW | 28,117 | 26,724 | 7,182* | 3.9 | 21.6 |
*Savings and payback shown are calculated on the most cost-effective tariff identified. On the farm's tariff at the time of the assessment, the verified saving was $5,685 per annum with a 4.9-year payback. Growers receiving drought relief should compare tariff options against their own account, as the relief waiver changes which tariff is cheapest.
Table 3. Pre and Post Implementation energy consumption, costs, and energy productivity improvements.
| Metric | Pre-Implementation | Post-Implementation | Reduction % |
| Energy Consumption (kWh) | 274,418 | 247,694 | 10 |
| Energy Costs ($) | 58,373 | 51,191 | 12 |
| Energy Productivity (kWh/ha) | 572 | 516 | 10 |
| Pump performance (kWh/ML/m head) | 8.10 | 4.18 | 48 |
An energy audit is a good investment
An energy audit is a great first step in moving a business towards a more efficient future by reducing energy use, costs, and Carbon emissions onsite.
The Energy Savers Plus Extension Program was delivered in by the Queensland Farmers' Federation with support and funding from the Queensland Department of Energy and Public Works.

Get in Touch
Do you have questions about energy on your farm? Enter your details to receive a call from the Queensland Farmers’ Federation. Learn more here. You can also subscribe to QFF’s quarterly newsletter for information on energy events, funding opportunities and ag news.
Phone: 07 3329 7500