Lockyer Valley Dairy Farm
Energy Savings: 26% | Cost Savings: $7,508 | Capital Cost: $37,000 | CO2 Savings: 43.3 | Project Status: implemented
Industry:
Dairy
Location:
South-East
Pump Type:
Centrifugal
Irrigation Type:
Travelling gun
Technology:
Solar Power and Renewables
An objective of the audit was to identify measures to keep energy consumption from the milking meter below 100,000 kWh per year (or 100 MWh) so that the farm can remain a Small User and remain on small business tariffs.
The preliminary analysis identified potential energy savings for the milking shed, including:
- The difference between the incoming coolant and the outgoing milk was 3 degrees, higher than expected for the type of plate cooler, which should be 2 degrees or less.
- Vacuum milk pumps rationalisation, moving from two to one pump using an isolator.
- Installing a Variable Speed Drive (VSD) on the vacuum pump.
- A more detailed investigation of chiller systems.
- Installing of a 30kW roof-mounted solar PV system.
Table 1. Energy and cost savings from audit recommendations.
| Recommendation | Annual Energy Savings (kWh) | Capital Cost ($) | Annual Cost Savings ($) | Payback Period (years) |
| Plate cooler maintenance | 654 | 0 | 126 | Immediate |
| Milking vacuum pumps | 14,413 | Up to 1,000 | 2,973 | Immediate |
| Install a Variable Speed Drive (VSD) on the vacuum pump | 3,603 | Up to 5,500 | 743 | 5.7 |
| Installation of a 30kW solar system | 46,500 | 37,000 | 6,880 | 7.4 |
| Total | 65,170 | 43,500 | 10,721 | 3.3 |
The grower has proceeded with the implementation of the 30kW solar PV system. The savings have been measured in a Measurement and Verification (M&V) process as outlined in Table 2.
Table 2. Estimated and Actual energy and cost savings from Solar PV.
| Metric | Audit estimation | M&V calculation | Variation (%) |
| Energy Savings including exports (kWh) | 46,500 | 53,400 | 15 |
| Cost Savings including exports revenue ($) | 6,880 | 7,506 | 9 |
Higher energy savings have been achieved, given the greater efficiency of the solar system. The higher solar generation has allowed offsetting the increase in energy consumption given the greater production of the farm, thus keeping the energy consumption of the milking meter below 100,000 kWh per year.
The cost savings from solar exports have been estimated using a conservative feed-in tariff as the farm has no export revenue at the moment since it is on demand tariff 44. The business aims to move to a consumption tariff in the short term.
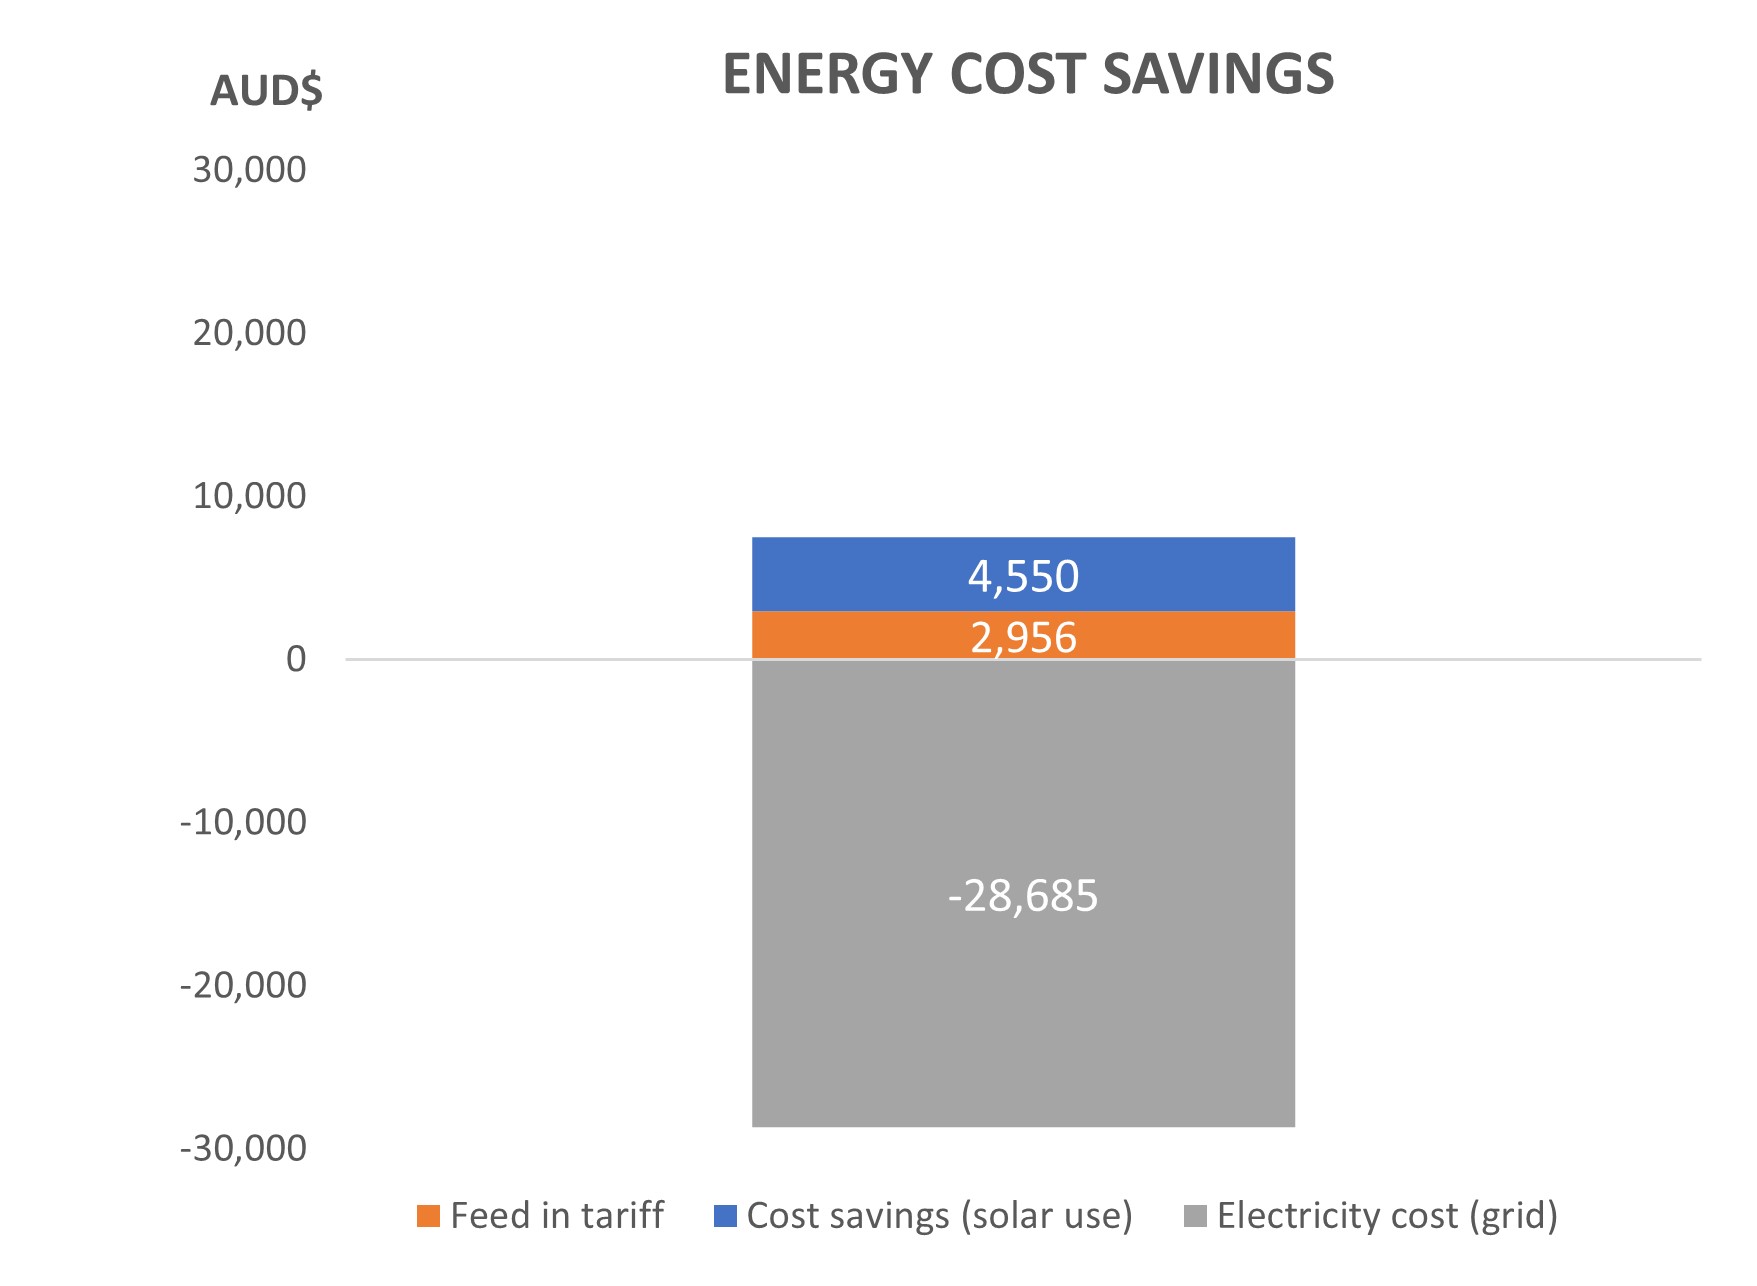
From the solar generation, 15,695 kWh or 30% are being used onsite valued at $4,550, and around 37,705 kWh are being exported to the grid with expected revenue of $2,956. Considering that 98,915 kWh – 86% of the total energy used onsite – are being imported from the grid at a cost of $28,685, there are significant potential savings from shifting consumption into the solar generation period. The total power balance of the farm, including solar exports and the energy cost distribution, are shown in the following figures.


The next step for the farm is to adjust energy usage to offset as much energy consumption as possible from the grid, which would lead to further cost savings. The revenue from feeding into the grid is lower than the cost savings from using the energy onsite: for every dollar of energy exported, more than $4 could be saved if the energy were consumed onsite. If the farm were to shift 37,705kWh of energy consumption per year to coincide with solar generation times, they would save an extra $7,978 per year.

By implementing the solar PV system, the farm has reduced energy consumption by 26% and costs by 14% based on pre-audit values, with carbon emission savings of 43.3 tCO2-e per year. The solar system also allows the farm to keep the energy consumption in the milking meter below 100 MWh/year despite the increase in consumption post-audit.
Table 3. Pre and post implementation energy and cost savings.
| Metric | Pre-Implementation | Post-Implementation | Reduction (%) |
| TOTAL farm energy consumption (kWh) | 205,456 | 152,056 | 26 |
| TOTAL farm energy costs ($) |
52,000 | 44,494 | 14 |
The dairy farm produces feed onsite using the following irrigation infrastructure:
- 40ha part circle, 470m span centre pivot.
- A total of 84ha irrigated by several soft hose travelling irrigators.
- A network of 150mm and 100mm PVC underground pipelines linking several pump sites and dams to irrigate 124 ha.
Currently, water is supplied to the irrigators from a dam using a 100x65x250 pump running at 42% efficiency and connected to a 37kW motor with a VSD. With an average annual energy use of 57,387kWh, it currently delivers 7.3kWh/ML/m, above a typical benchmark for energy used at 5kWh/ML/m.
The recommendations in the audit explored different options to replace current infrastructure, reduce costs and improve the system’s overall efficiency.
Table 1. Energy and cost savings from audit recommendations.
| Recommendation | Capital Cost ($) | Annual Energy Savings (kWh) | Annual Cost Savings ($) | Payback Period (years) |
| Investigate inefficient pump and fix (keep existing suction line) | 2,500 | 24,505 | 5,955 | 0.41 |
| Investigate inefficient pump to fix it and install new 200mm HDPE suction line | 5,000 | 24,505 | 5,955 | 0.83 |
| Replace pump (keep existing suction line) | 8,000 | 24,505 | 5,955 | 1.34 |
| Replace pump and install new 200mm HDPE suction line | 10,500 | 24,505 | 5,955 | 1.76 |
| New centre pivot (34ha)
(savings include labour, production, and scheduling) |
220,000 | 35,516 | 35,031 | 6.28 |
| New centre pivot (16ha)
(savings include labour, production, and scheduling) |
140,000 | 16,245 | 16,907 | 8.28 |
Travelling irrigators typically have a low distribution and co-efficient of uniformity, leading to over and under watering in the paddocks. Installed on a separate meter, energy use is currently 48,433kWh per annum.
There are considerable costs involved when moving to a centre pivot, and it is important to determine the highest returns for your business. As centre pivots operate at lower water pressure than travelling guns, they can offer energy efficiency gains, reduced costs, and improved production. Further, the reduced labour required in running the pivot can lead to significant additional savings.
With large variability in Australia’s rainfall, water is stored in dams with the energy required to move water around the farm, often involving double-pumping, that is pumping to harvest water into storage then irrigation pumping. If water can be saved, then energy can be saved as well.
Table 2. Efficiency of irrigation improvements recommended.
| Irrigation System | Distribution of Uniformity (%) | Scheduling Coefficient | Energy Savings (kWh) |
| Travelling Gun | 41 | 2.5 | N/A |
| Centre Pivot (34ha) | 90 | 1.11 | 12,918 |
| Centre Pivot (16ha) | 90 | 1.11 | 6,547 |
The lower scheduling coefficient results in reduced run times leading to energy savings. The centre pivot will consume the same volume of water (or more), though with improved uniformity an increase in production-per ML of water can result. With an estimated increase of 2t of dry matter (DM) per hectare, the farm could expect an increase in production value.
Table 3. Productivity of irrigation improvements recommended.
| Recommendation | Production (DM/ha/Year) | Production Increase (t/DM) | Production Value ($) |
| Travelling Gun | 6-8 | N/A | N/A |
| Centre Pivot (34ha) | 8-12 | 68 | Up to 40,000 |
| Centre Pivot (16ha) | 8-12 | 32 | Up to 20,000 |
With a quicker payback, the audit recommended installing a new centre pivot over 34ha. The suction line should be replaced, and the pump investigated for potential issues. If repair of the pump is not cost-effective, then it is recommended to replace it.
From the above and combined with the potential energy reductions on the milking enterprise, the farm could reduce the overall site consumption and costs onsite across a few energy meters.
An energy audit is a good investment
An energy audit is a great way for a business to cut costs and boost productivity.
The Energy Savers Plus Extension Program was delivered by the Queensland Farmers' Federation with support and funding from the Queensland Department of Energy and Public Works.

