Mareeba Irrigation Farm
Energy Savings: 113% | Cost Savings: $9,800 | Capital Cost: $43,500 | CO2 Savings: 57.6 | Project Status: implemented
Industry:
Grains and fodder
Location:
Atherton Tablelands
Pump Type:
Centrifugal
Irrigation Type:
Centre Pivot
Technology:
Irrigation and Pumps, Tariffs, Solar Power and Renewables, Variable Speed Drives
The farm produces around 7,000t of hay over 41 hectares, with most of the energy used for irrigation. The annual energy consumption for the site during the 2018-2019 period was 63,642kWh at a cost of $14,052.
The energy audit identified several opportunities to reduce energy consumption and cut costs, including:
- Installing a 40kW solar system with a 30kW inverter to cover baseload power with possible export.
- Installing an automated control system with an SMS alert in the pump station, with a capital cost of $3,500.
- A change in strategy to day-time pumping using energy produced from solar onsite, with a shift to Tariff 20.
| Recommendation | System Cost | Energy Savings T62 (kWh) | Energy Savings T20 (kWh) | Cost Savings T62 ($) | Cost Savings T20 ($) | Payback period T62 (Years) | Payback Period T20 (Years) | Emission Savings T62 (tCO2-e) | Emission Savings T20 (tCO2-e) |
| 40kW Solar PV | 40,000 | 3,999 | 46,656 | 1,851 | 12,539 | 21 | 3.2 | 3.2 | 37.3 |
After talks between the auditor, electrician, and the farmer, the site’s best efficiency and production outcomes were determined. The solar system has been designed to cover the load expected by the pump with any allowable export to the grid.
The 39.6 kW Solar array with 30kW inverter capacity has been arranged in an East-West configuration. As the irrigators run for long periods, the panels facing East will get to maximum capacity earlier in the morning, and the panels facing West will produce maximum power in the afternoon, providing constant supply throughout the day.
As the inverter capacity is no larger than 30kW, the system was treated as a micro embedded generating unit keeping the connection process simple and meaning the farm can still export during times of no irrigation. Maintaining grid connection allows the irrigator to draw grid power when required.
The auditor recommended that the farm move to a flat rate Tariff 20 and shift pumping to daylight hours while the solar PV system produces enough energy. Implementation of solar PV will absorb the increased tariff rate and any potential price increases in the future, reducing the overall energy costs and consumption.
The farmer has implemented the Solar PV system and a Variable Speed Drive to reduce the speed of the motors due to high pressure delivered by the pump, causing leakages in the pivot system. The farmer has also switched to tariff 20. Further, ‘time’ efficiency measures have been achieved using automation on the centre pivot. With the main farmhouse around 10 minutes from the irrigator, regular drives are required to start and stop its operation. Additionally, the automation will reduce fuel usage and allow time to be better spent on the crop. Should the centre pivot stop working, an SMS is sent to a mobile device alerting the operator.
The savings made have been measured in a Measurement and Verification (M&V) process, as outlined in Table 2.
Table 2. Estimated and Actual annual energy and cost savings.
| Metric | Audit estimation | M&V calculation | Variation (%) |
| Energy Savings including exports (kWh) | 46,656 | 72,260 | 55 |
| Cost Savings including exports revenue ($) | 12,539 | 9,815 | -22 |
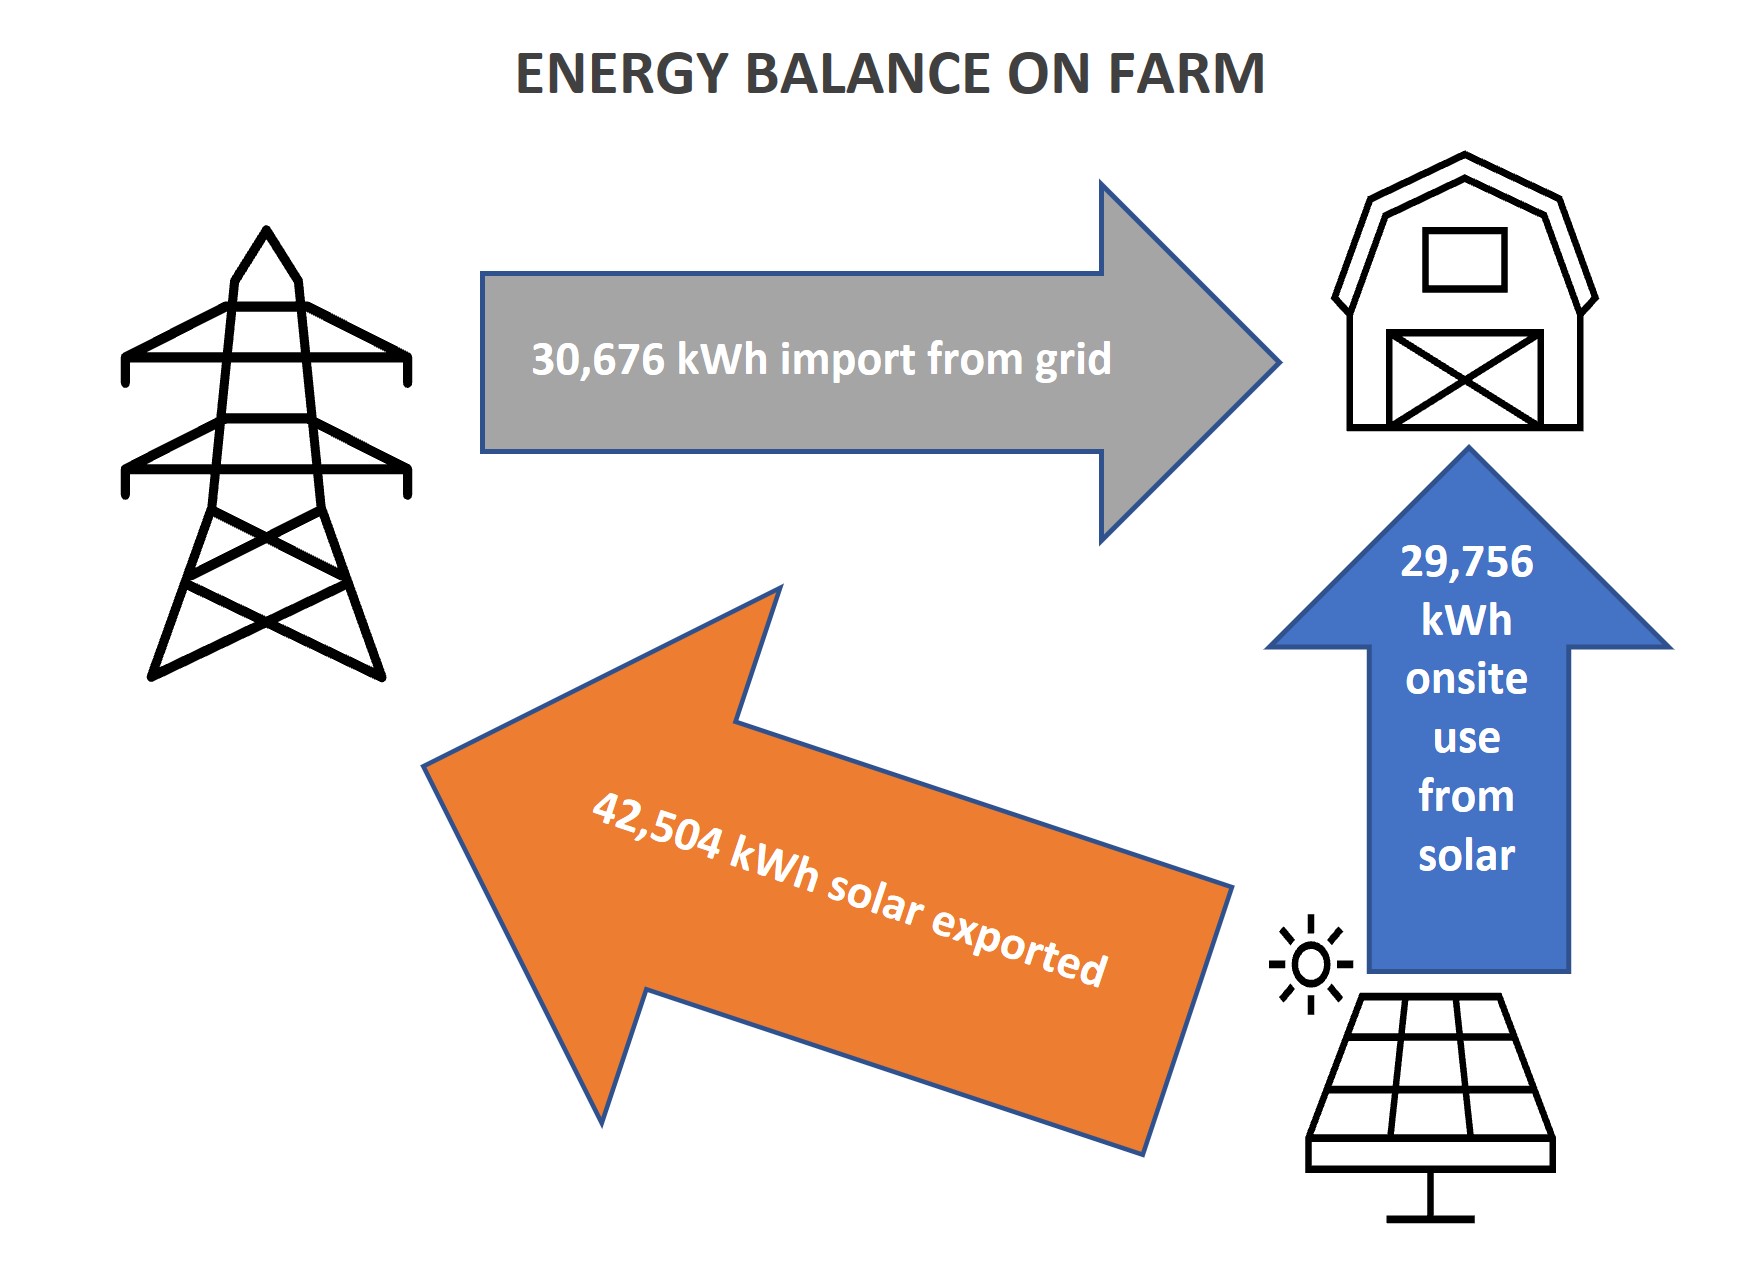
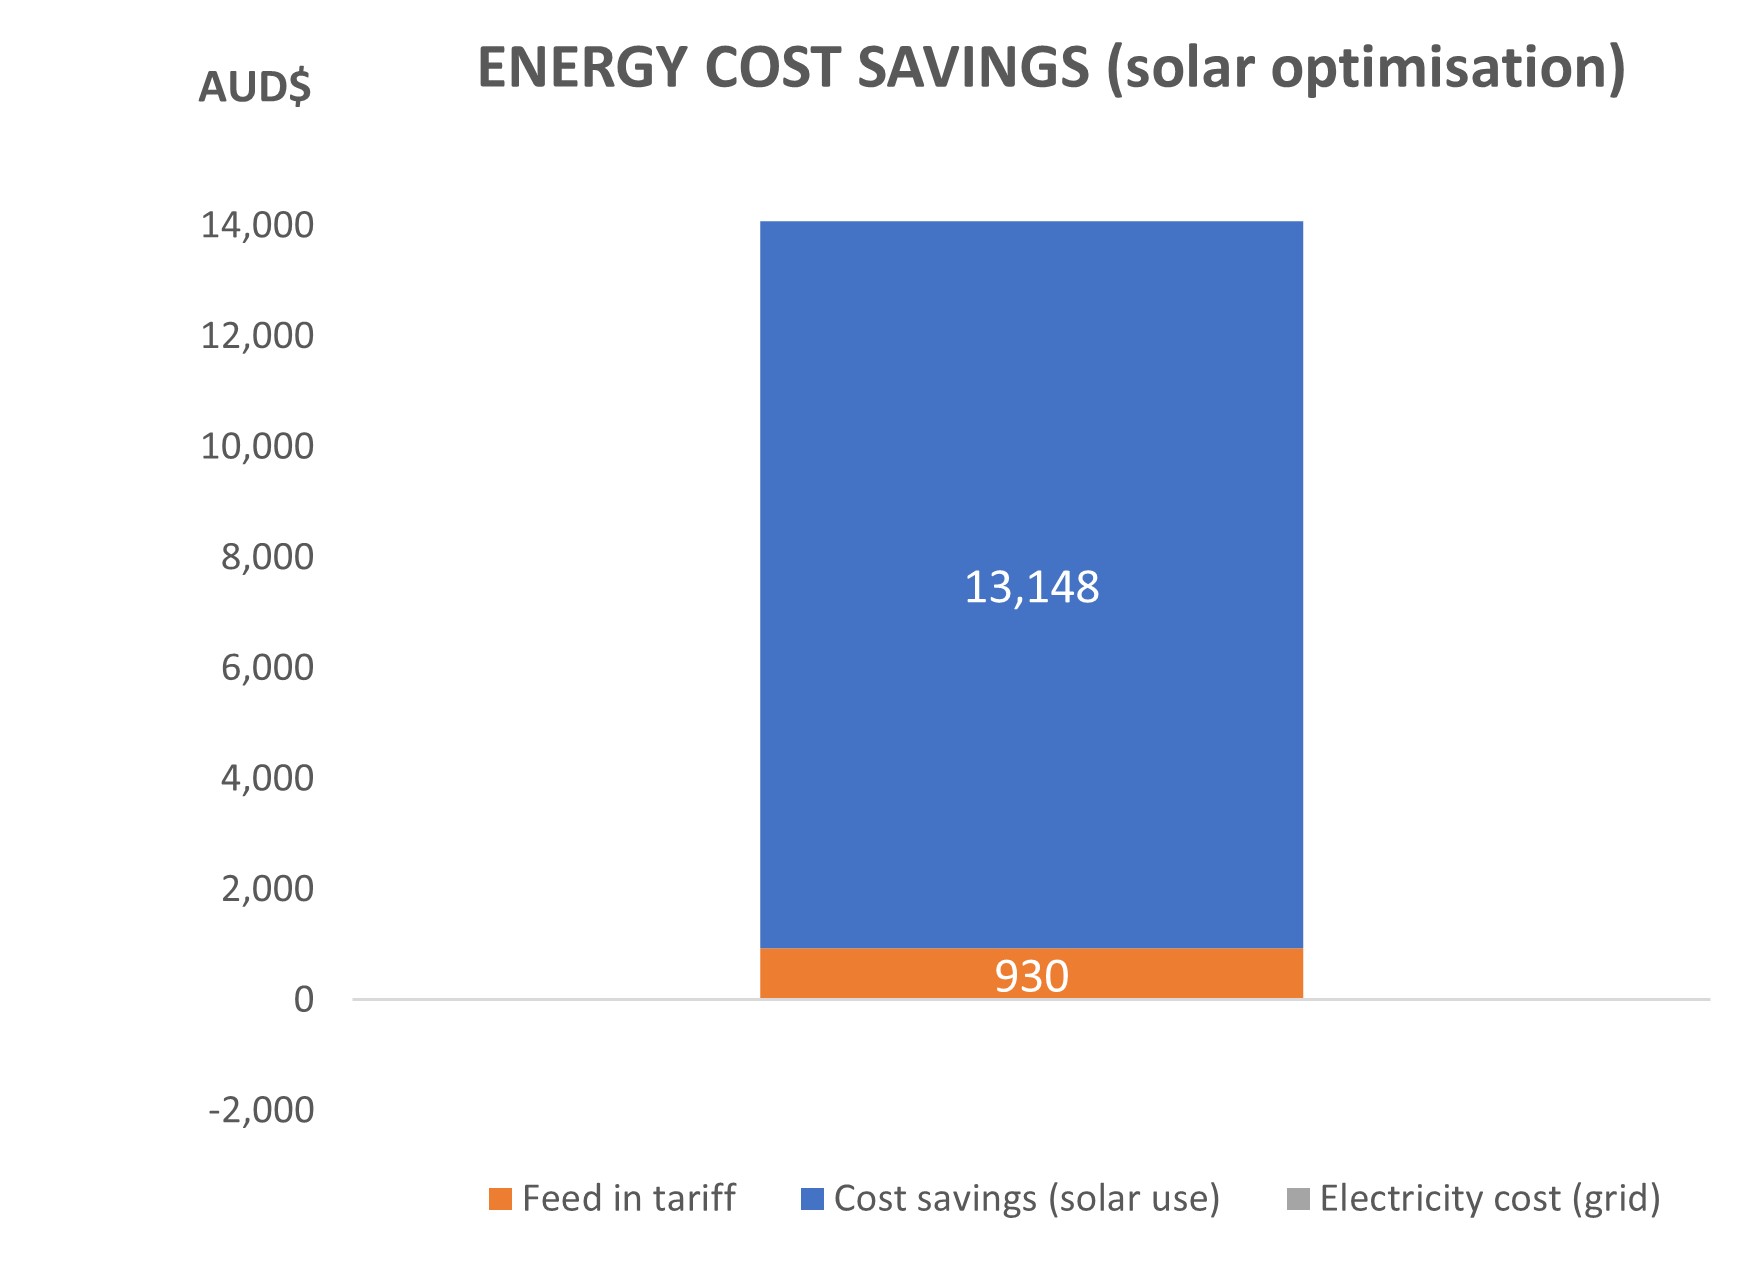
The lower cost savings measured compared to the estimated have been affected by the high amount of energy exported to the grid and the low 2020 feed-in tariff. Only 29,756 kWh or 41% of total generation are being used onsite valued at $6,474, and 42,504 kWh are being exported to the grid with a revenue of $3,341. Considering that 30,676 kWh – 52% of the total energy used onsite – are being imported from the grid at a cost of $6,674, there are significant potential savings from shifting consumption into the solar generation period. The total power balance of the farm, including solar exports and the energy cost distribution, are shown in the following figures.


The next step for the farm is to adjust energy usage to offset as much energy consumption as possible from the grid, which would lead to further cost savings. The revenue from feeding into the grid is lower than the cost savings from using the energy onsite: for every dollar of energy exported, more than $4 could be saved if the energy were consumed onsite. If the farm were to shift 30,676kWh of energy consumption per year to coincide with solar generation times, they would save an extra $4,263 per year.

By implementing the recommendations in the audit, the farm has reduced energy consumption by 113%, including the energy exported to the grid, and costs by 70%, including feed-in revenue, with Carbon emission savings of 57.6 tCO2-e per year.
Table 3. Pre and post implementation energy, costs, and energy productivity improvements.
| Metric | Pre-implementation | Post-implementation | Reduction (%) |
| Energy Consumption (kWh) | 63,642 | -8,618 | 113 |
| Cost ($) | 14,052 | 4,237 | 70 |
| Energy Productivity (kWh/ton) | 9.1 | -1.2 | 113 |
The accuracy of the recommendations in the audit, coupled with the specialist electrician’s advice, provided the best possible outcome for the farm. Energy consumption from the grid could be further reduced by matching pump use with solar generation.
An energy audit is a good investment.
An energy audit is a great way for a business to cut costs and boost productivity.
The Energy Savers Plus Extension Program was delivered by the Queensland Farmers' Federation with support and funding from the Queensland Department of Energy and Public Works.

