
Queensland Horticulture Farms
Energy Savings: 38% | Cost Savings: $526,361 | Capital Cost: $2,953,682 | CO2 Savings: 1,448 | Project Status: proposed
Industry:
Horticulture
Location:
Queensland
Pump Type:
Not applicable
Irrigation Type:
Not applicable
Technology:
Heating, Irrigation and Pumps, Lighting, Motors and Fans, Solar Power and Renewables, Variable Speed Drives
The total energy consumption from the measured areas on the 41 farms was 4,619,701kWh at an annual cost of $1,002,647, resulting in emissions of 3,742 tonnes of CO2-e per annum.
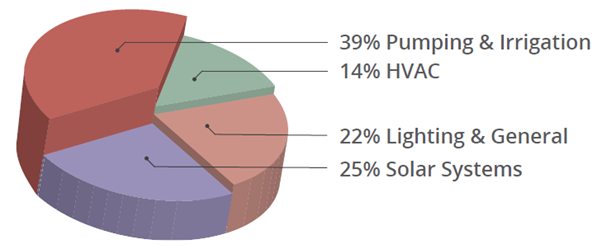
Opportunities: the main opportunities identified on Horticulture farms include
- Pumping and Irrigation Upgrades– Savings from Variable Speed Drive (VSD) installation, pump replacements and maintenance, and changes to irrigation design and automation.
- Heating Ventilation and Cooling (HVAC). Maintenance and upgrades for condenser motors including VSD, ventilation fan and heating.
- Lighting and General- Replacement and retrofitting of lights with LEDs, infrastructure upgrades to facilitate efficiency gains and general management changes.
- Solar Systems- Ranging in size from 5-100kW systems.
Table 1. Technology Recommendations and Savings in the Horticulture Industry.
Recommendation |
Total | Energy Savings (kWh) | Cost Savings ($) | Capital Cost ($) | Average Payback (Years) | Emission Reduction (tCO2-e) |
Pumping and Irrigation Upgrades |
52 | 608,113 | 202,497 | 1,802,342 | 19 | 493 |
HVAC |
19 | 177,513 | 49,194 | 487,032 | 9 | 144 |
Lighting and General |
30 | 113,839 | 34,796 | 275,652 | 7 | 92 |
Solar Systems |
34 | 888,019 | 239,874 | 1,353,324 | 6 | 719 |
Total |
134 | 1,787,484 | 526,361 | 2,953,682 | 10.2 | 1,448 |
Total Recommendations |
665 | 7,459,015 | 2,817,342 | 12,784,670 | 6.85 | 6,042 |
Table 1 highlights the potential energy savings of 1,787,484kWh identified in the audits.
Including production benefits, a saving of $526,361 and an estimated 1,448 tonnes of CO2-e could be realised per annum. At a capital cost of $2,953,682, the average payback was 10.2 years.
Additional value adding from the energy audits showed how an increase in water delivery, could increase production and profit with a reduction in energy consumed per unit of output.
Table 2. Pre and Post Audit Metrics.
| Metric | Pre-Audits | Post- Audits | Reduction (%) |
Energy Consumption (kWh) |
4,619,701 | 2,832,217 | 38 |
Energy Costs ($) |
1,002,647 | 476,286 | 52 |
Emissions (tCO2-e) |
3,742 | 2,294 | 38 |
As the installation of the recommendations is made within the industry, measurement and verification will be undertaken, and case studies will be updated to include the actual energy savings.

Energy Efficiency for your Industry and Business
An energy audit is a great way for a business to cut costs, reduce emissions and boost productivity.
The Energy Savers Plus Extension Program was delivered by the Queensland Farmers' Federation with support and funding from the Queensland Department of Energy and Public Works.