Western Downs Cattle Farm
Energy Savings: 64% | Cost Savings: $6,724 | Capital Cost: $26,485 | CO2 Savings: 28.5 | Project Status: implemented
Industry:
Beef
Location:
Darling Downs
Pump Type:
Bore
Irrigation Type:
Not applicable
Technology:
Solar Power and Renewables
The farm is a cattle feedlot with supplementary crops of grain and hay. To supply the cattle with food and water, the farm contains the following systems:
- A 3.7kW three-phase pump powered by a diesel generator to pump water to the header storage tank each night.
- A solar pump in the field pumping to the header tank.
- Dam diesel pump used to supplement the bore’s in summer.
- Two other solar pumps pumping to local tanks.
- Feed mill, which contains rollers, augers and molasses pump.
The annual energy consumption for the site during the 2018-2019 period was 55,000 kWh at a cost of $16,900. This equates to a total energy cost per head of $4.30. If all recommendations are implemented, the energy cost per head would be reduced to $0.86.
A recent energy audit showed how improving the current systems can lead to energy and cost savings. The audit recommended to install:
- A Solar pump system: to replace the diesel generator at the bore pump by adding batteries or using the existing diesel generator as backup.
- Variable Frequency Drive (VFD) on several 3-phase feed mill motors.
- Install control on the House Bore Pump.
- A 17kW Solar PV: to offset the electricity consumption in the mill.
Table 1. Costs and savings from audit recommendations.
| Recommendations | Annual Energy Savings (kWh) | Annual Cost Savings ($) | Emission Savings (tCO2-e) | Capital Cost ($) | Payback Period (years) |
| Solar Pump with Generator Back-Up or Batteries | 48,700-73,050* | 5,990-9,935 | 14.2-21.3 | 15,000-27,500 | 2.2-2.7 |
| VFD on feed mill motors | 16,000 | 4,522 | 13 | 5,200 | 1.1 |
| Bore Pump control | 0 | 750 | – | 1,500 | 2 |
| 17kW Solar PV | 36,108 | 9,750 | 29.2 | 23,427 | 2.5 |
*Converted from litres of diesel (1Lt = 10 kWh)
Based on that, the farmer has proceeded with the implementation of a 17kW Solar PV system to offset the electricity consumption in the mill. The savings made have been measured in a Measurement and Verification (M&V) process, as outlined in Table 2.
Table 2. Estimated and Actual energy and cost savings.
| Metric | Audit estimation | M&V calculation | Variation (%) |
| Energy Savings including exports (kWh) | 36,108 | 35,180 | -3 |
| Cost Savings including exports revenue ($) | 9,750 | 6,724 | -31 |
The lower cost savings measured compared to those estimated from the audit recommendation have been influenced by an approximated 13% reduction in the retail price of electricity plus a lower than expected correlation between solar generation and mill run-time. If the farm were to shift more of their daily electricity consumption to the middle of the day, the savings would increase.
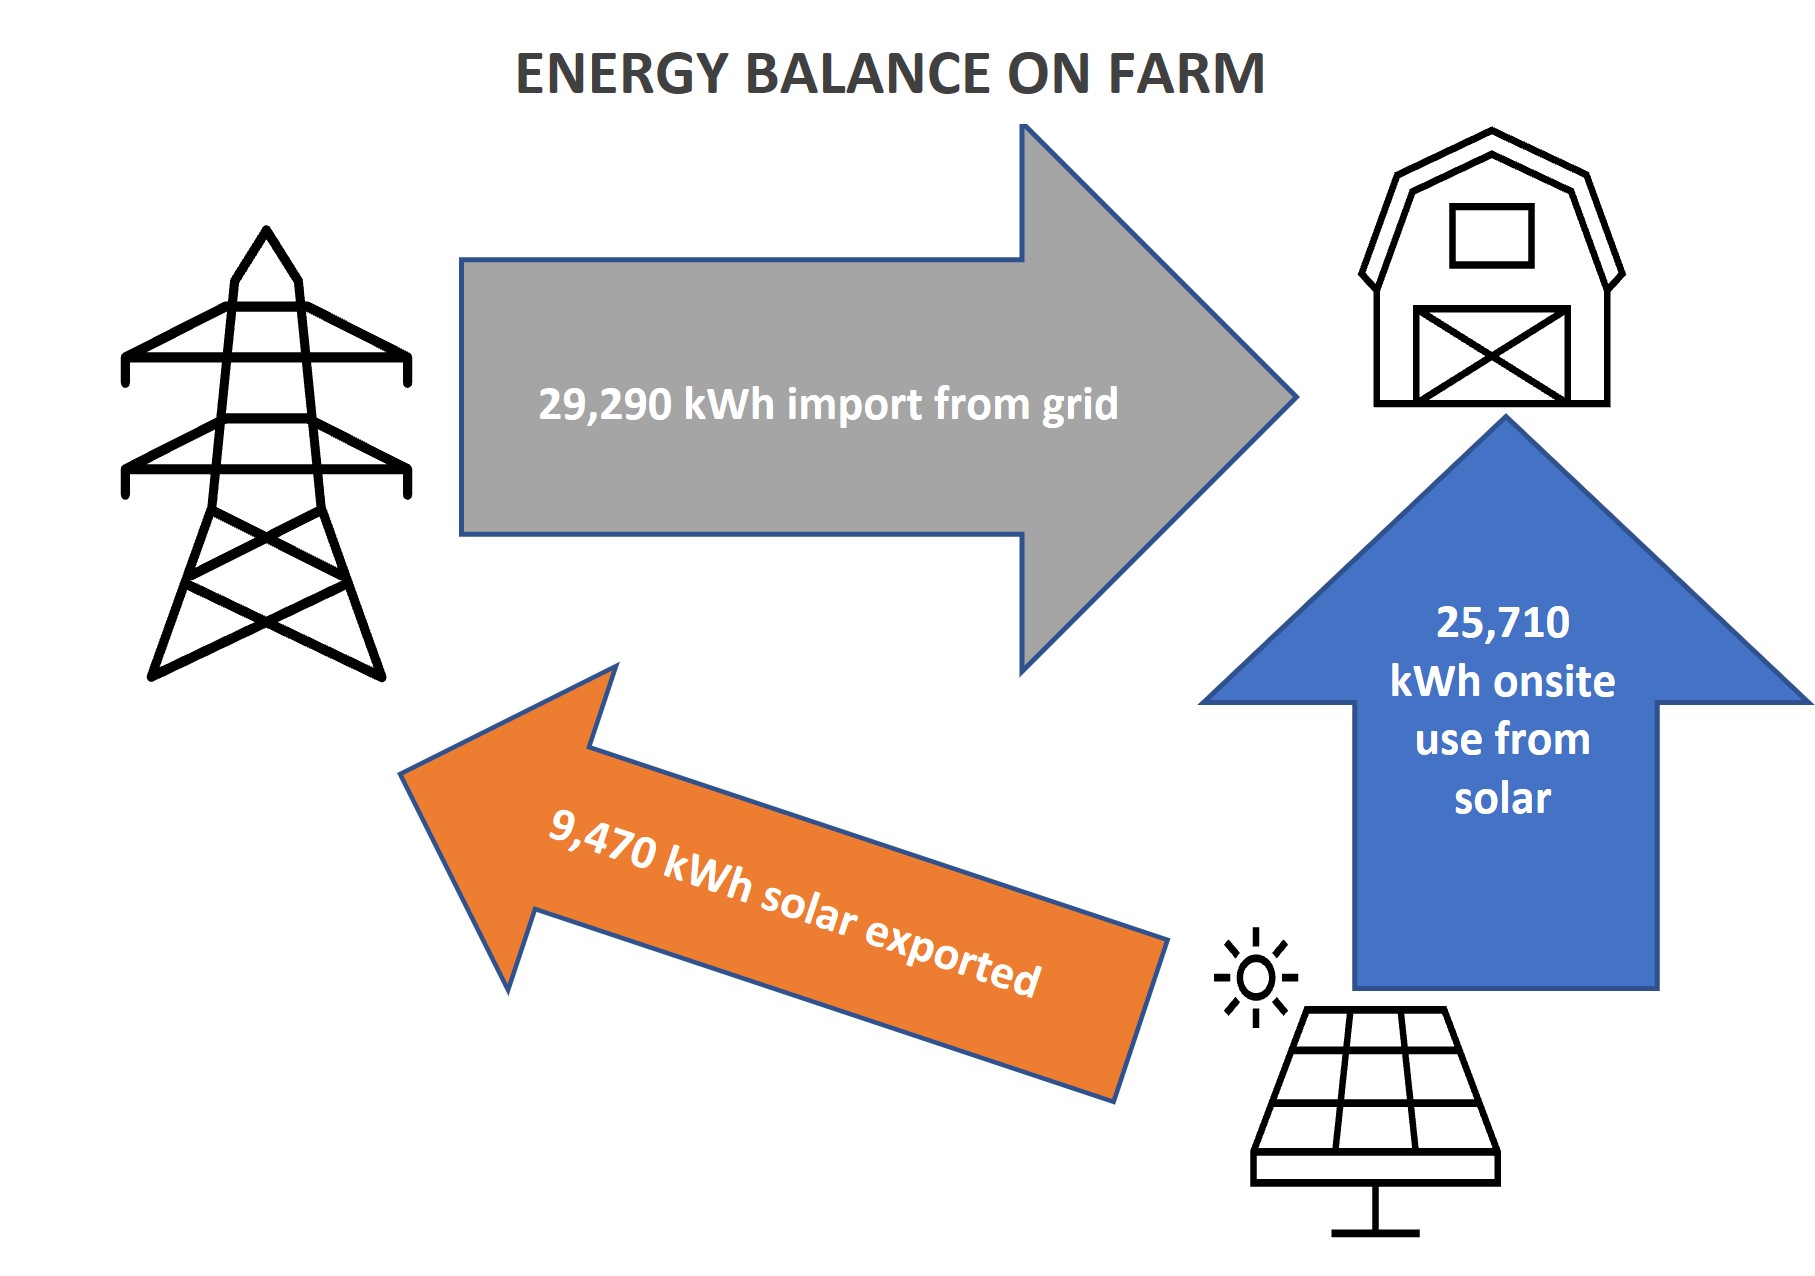
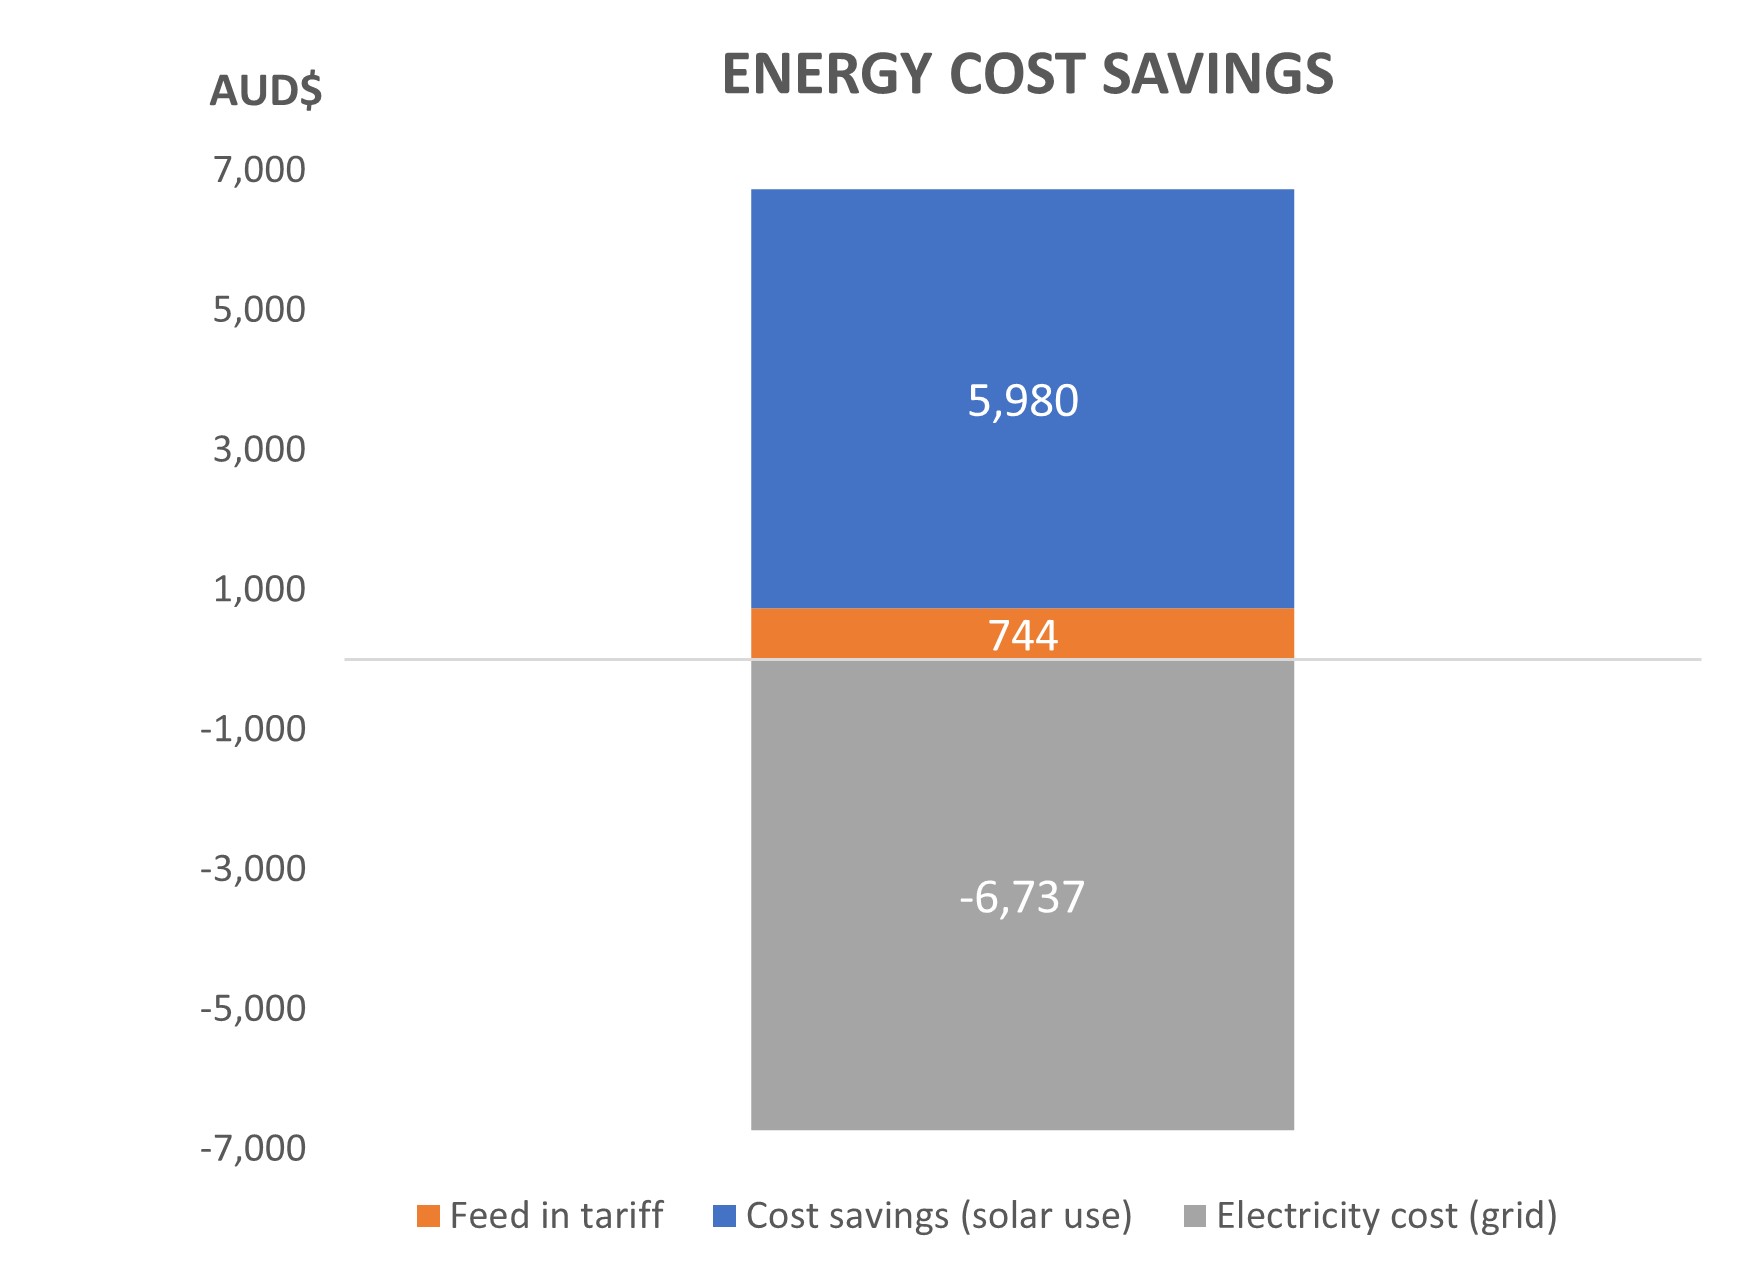
From the solar generation, 73% or 25,710 kWh are being used onsite valued at $5,980, and 9,470 kWh are being exported to the grid with a revenue of $744. Considering that 29,290 kWh – 53% of the total energy use onsite – are being imported from the grid at a cost of $6,737, there are significant potential savings from shifting consumption into the solar generation period. The total power balance of the farm, including solar exports and the energy cost distribution, are shown in the following figures.


The farm has also implemented another electric bore pump on a separate NMI to help fed water to the header tank, which has reduced the need for a PV assisted system for the diesel Genset bore. Since the new pump has increased the cost of electricity, the farm is looking into a solar system for that NMI.
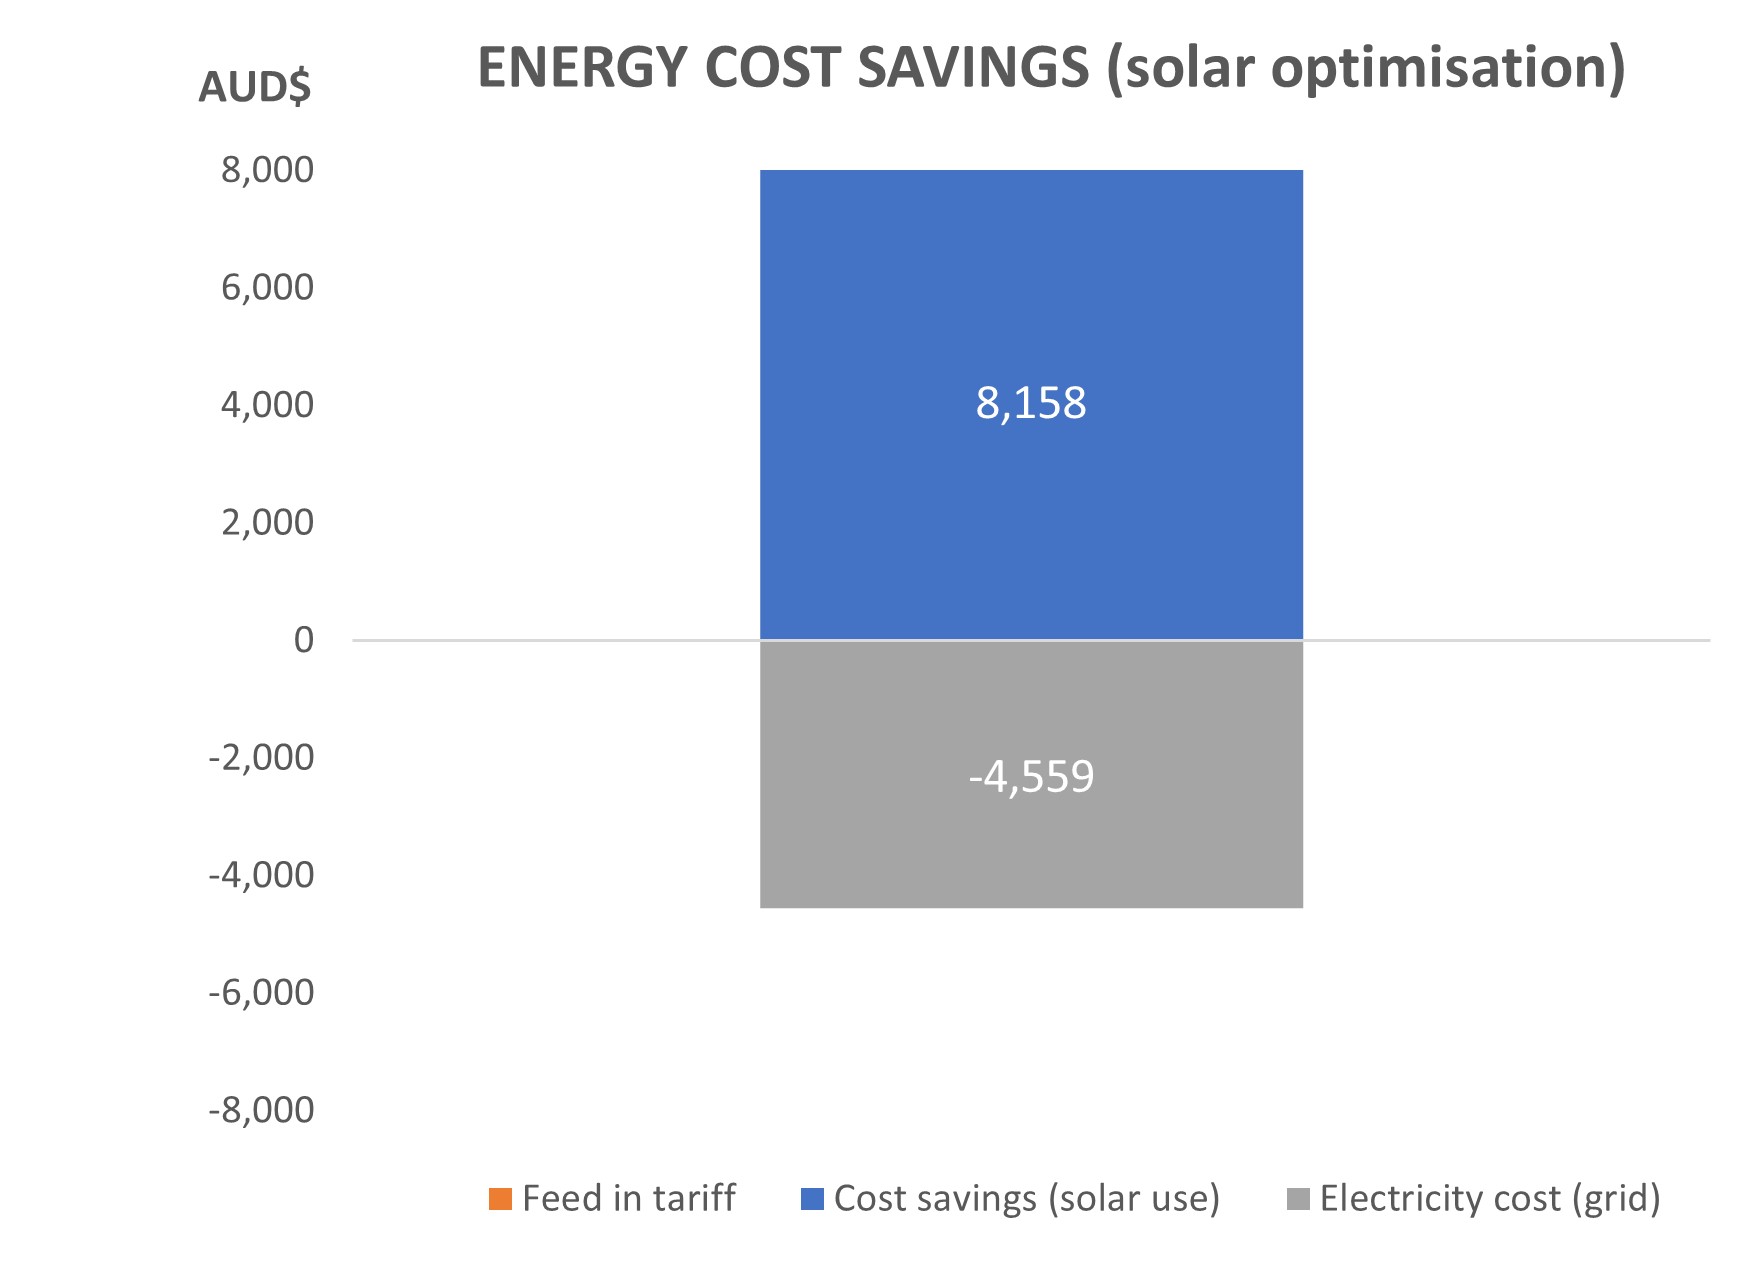
The next step for the farm is to adjust energy usage to offset as much energy consumption as possible from the grid, which would lead to further cost savings. The revenue from feeding into the grid is lower than the cost savings from using the energy onsite: for every dollar of energy exported, around $2 could be saved if the energy were consumed onsite. If the farm were to shift 9,470kWh of energy consumption per year to coincide with solar generation times, they would save an extra $1,434 per year.

From the implementation of recommendations in the audit, the farm has reduced energy consumption by 64% and costs by 40%, including feed-in revenue, with Carbon emission savings of 28.5 t/CO2-e per year.
Table 3. Pre and post implementation energy and cost improvements.
| Metric | Pre-implementation | Post-implementation | Reduction (%) |
| Energy Consumption (kWh) | 55,000 | 19,820 | 64 |
| Cost ($) | 16,900 | 10,176 | 40 |
An energy audit is a good investment.
An energy audit is a great way for a business to cut costs and boost productivity.
The Energy Savers Plus Extension Program was delivered by the Queensland Farmers' Federation with support and funding from the Queensland Department of Energy and Public Works.

